
If you're a Joomla extension developer in 2026, debugging PHP can still feel like navigating a maze — but the tools available today make it far more manageable than they once did. Xdebug remains the gold standard for PHP debugging, and with Joomla running on PHP 8.3 and 8.4 across most modern stacks, getting Xdebug properly configured on macOS via Homebrew is a skill worth having. This guide walks you through a current, working setup: from installation through to live breakpoint debugging in your IDE of choice.
TL:DR – Set up Xdebug 3.4+ on macOS via Homebrew to streamline your Joomla development. Ensure you have Homebrew and PHP 8.3 or 8.4 ready, install Xdebug via PECL, configure a dedicated xdebug.ini, and integrate with VSCodium or VS Code. The result is a clean, step-through debugging experience that replaces guesswork with clarity.
Contents
What's changed in 2026
A few things have shifted since earlier versions of this guide were written. Xdebug 3.4 is now the stable release, bringing improved performance and compatibility with PHP 8.4's revised internal APIs. If you're still running Xdebug 2.x or an early 3.x build, it's worth upgrading — the configuration syntax and default port (9003, not the old 9000) have been stable since Xdebug 3.0, but 3.4 resolves several edge cases around fibre debugging and named arguments that affect Joomla's component architecture.
On the macOS side, Apple Silicon is now the dominant hardware platform. Homebrew handles the ARM/x86 distinction transparently for most users, but it's worth confirming your PHP binary is native ARM (arch -arm64 php -v) rather than running under Rosetta 2, which can introduce subtle timing issues with Xdebug's socket connections. If you're on an Intel Mac, nothing here changes for you.
Joomla itself has moved forward. Joomla 5.x is the current stable branch, built on PHP 8.1 as a minimum and fully tested on 8.4. The debugging patterns described here apply equally to Joomla 4.x and 5.x codebases.
Finally, the IDE landscape has settled. VS Code and VSCodium remain the most popular choices for PHP debugging on macOS, and PhpStorm continues to be the premium option for teams who want deeper Joomla-aware tooling. All three work well with the setup described below.
Xdebug overview
Xdebug is a PHP extension that transforms debugging from a process of educated guessing into a structured, observable workflow. It lets you set breakpoints, step through code line by line, inspect variable values at runtime, and examine the full call stack. For Joomla developers, this is particularly valuable: Joomla's event-driven architecture and deep inheritance chains can make bugs genuinely difficult to trace with var_dump() alone.
Xdebug also supports profiling and code coverage analysis, which are useful for performance work and testing respectively — but this guide focuses on step debugging, which is where most developers start and where the day-to-day value lies.
Prerequisites
Before diving into the installation, confirm you have the following in place:
- Homebrew — the macOS package manager. If you don't have it, install it from brew.sh. Keep it updated with
brew updatebefore proceeding. - PHP 8.3 or 8.4 via Homebrew — install with
brew install php(which gives you the current stable release) orbrew install php@8.3for the previous stable. Avoid mixing Homebrew PHP with the system PHP Apple ships — they don't share extensions cleanly. - A local Joomla installation — Joomla 5.x is recommended. A simple local stack using Laravel Valet, MAMP, or a plain Homebrew Apache/Nginx setup all work fine.
- An IDE — VSCodium, VS Code, or PhpStorm. The steps below use VSCodium, but VS Code is identical in practice.
Installing Xdebug via Homebrew on macOS
With Homebrew PHP in place, install Xdebug using PECL, which is bundled with Homebrew's PHP:
% pecl install xdebugPECL will fetch the latest stable release, compile it against your current PHP version, and place the extension in the correct directory. There's a fair amount of output during compilation — this is normal. Once it completes, verify the installation:
% php -vA successful install looks like this:
% php -v
PHP 8.4.8 (cli) (built: Jun  3 2025 16:29:26) (NTS)
Copyright (c) The PHP Group
Built by Homebrew
Zend Engine v4.4.8, Copyright (c) Zend Technologies
    with Zend OPcache v8.4.8, Copyright (c), by Zend Technologies
    with Xdebug v3.4.4, Copyright (c) 2002-2025, by Derick Rethans
If Xdebug doesn't appear here, check that PECL wrote to the correct PHP installation. Run which php and php --ini to confirm you're working with the Homebrew binary and its associated configuration directory.
Configuring Xdebug: the xdebug.ini file
PECL's installer adds a zend_extension=xdebug line to your main php.ini, but this isn't ideal for maintainability. The better approach is a dedicated xdebug.ini file in PHP's conf.d directory, which keeps your Xdebug configuration isolated and easy to toggle.
Find your PHP configuration directory with:
% php --iniLook for the "Scan for additional .ini files" path — it will be something like /opt/homebrew/etc/php/8.4/conf.d/ on Apple Silicon, or /usr/local/etc/php/8.4/conf.d/ on Intel. Check whether a file with xdebug in the name already exists there. If PECL created one, edit it. If not, create 99-xdebug.ini (the 99- prefix ensures it loads last, after all other extensions).
Remove the zend_extension=xdebug line from php.ini if PECL added it there, then add the following to your 99-xdebug.ini:
zend_extension=xdebug
xdebug.mode=debug
xdebug.client_host=127.0.0.1
xdebug.client_port=9003
xdebug.start_with_request=trigger
A note on xdebug.mode: setting it to debug enables step debugging only. If you also want profiling, use xdebug.mode=debug,profile. Keeping the mode narrow avoids the performance overhead of features you're not using — particularly important when Xdebug is active in a browser session running a full Joomla page load.
The start_with_request=trigger setting means Xdebug only activates when a specific cookie or query parameter is present, rather than on every PHP request. This is the recommended approach for local Joomla development, where you don't want every CLI operation or cron job to attempt a debugger connection.
After saving the file, restart your web server (or PHP-FPM if you're using it) and confirm Xdebug is loaded:
% php -m | grep xdebugCreating a diagnostics file: xdebuginfo.php
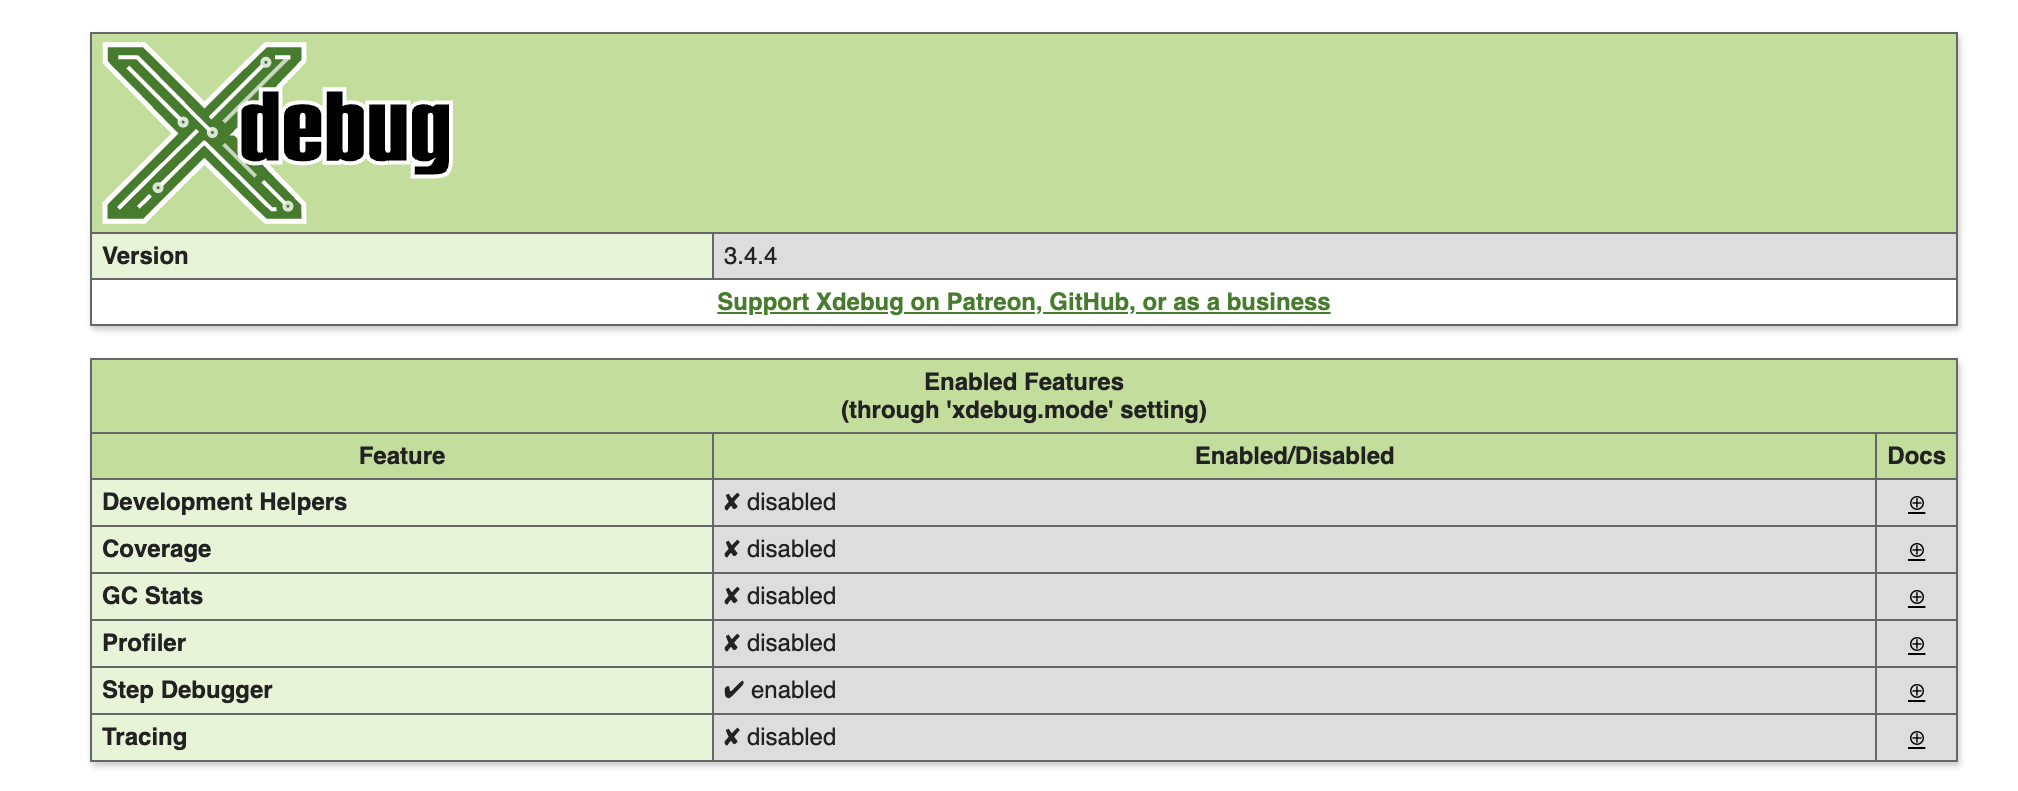
Before connecting an IDE, it's worth confirming that Xdebug is configured correctly at the PHP level. Create a file called xdebuginfo.php in the root of your Joomla installation with the following content:
<?php
xdebug_info();
?>
Access it in your browser. Look for the Enabled Features section — Step Debugger should be listed as enabled. If it isn't, double-check your 99-xdebug.ini for typos and confirm the file is being loaded by running php --ini again.
The diagnostics page also shows whether Xdebug can reach your IDE. At this stage it won't be able to, because you haven't started a debug session yet — that's expected.
Integrating Xdebug with VSCodium (or VS Code)
VSCodium is VS Code with Microsoft's telemetry removed — the two are functionally identical for debugging purposes. If you prefer VS Code, the steps below are the same.
- Open VSCodium and install the PHP Debug extension by Xdebug (published by
xdebug.php-debugin the marketplace). This is the actively maintained extension that supports Xdebug 3.x — don't confuse it with older PHP debug extensions that have been abandoned. - Open your Joomla project folder in VSCodium. The PHP Debug extension will offer to create a
launch.jsonfor you — accept this. The default configuration listens on port 9003, which matches thexdebug.client_portyou set earlier. -
Your
launch.jsonshould look similar to this:{ "version": "0.2.0", "configurations": [ { "name": "Listen for Xdebug", "type": "php", "request": "launch", "port": 9003 } ] } - Install a browser extension to trigger Xdebug sessions. Xdebug Helper (available for Chrome, Firefox, and Edge) is the current standard choice — it adds a small toolbar icon that lets you enable debug mode for a tab, which sets the
XDEBUG_SESSIONcookie that Xdebug is watching for. - In VSCodium, open your
xdebuginfo.phpfile and click in the gutter next to line 2 to set a breakpoint (the red dot). Then click the Run and Debug icon in the left sidebar and start the "Listen for Xdebug" configuration. - In your browser, enable Xdebug via the helper extension, then refresh the page. VSCodium should come to the foreground with execution paused at your breakpoint.
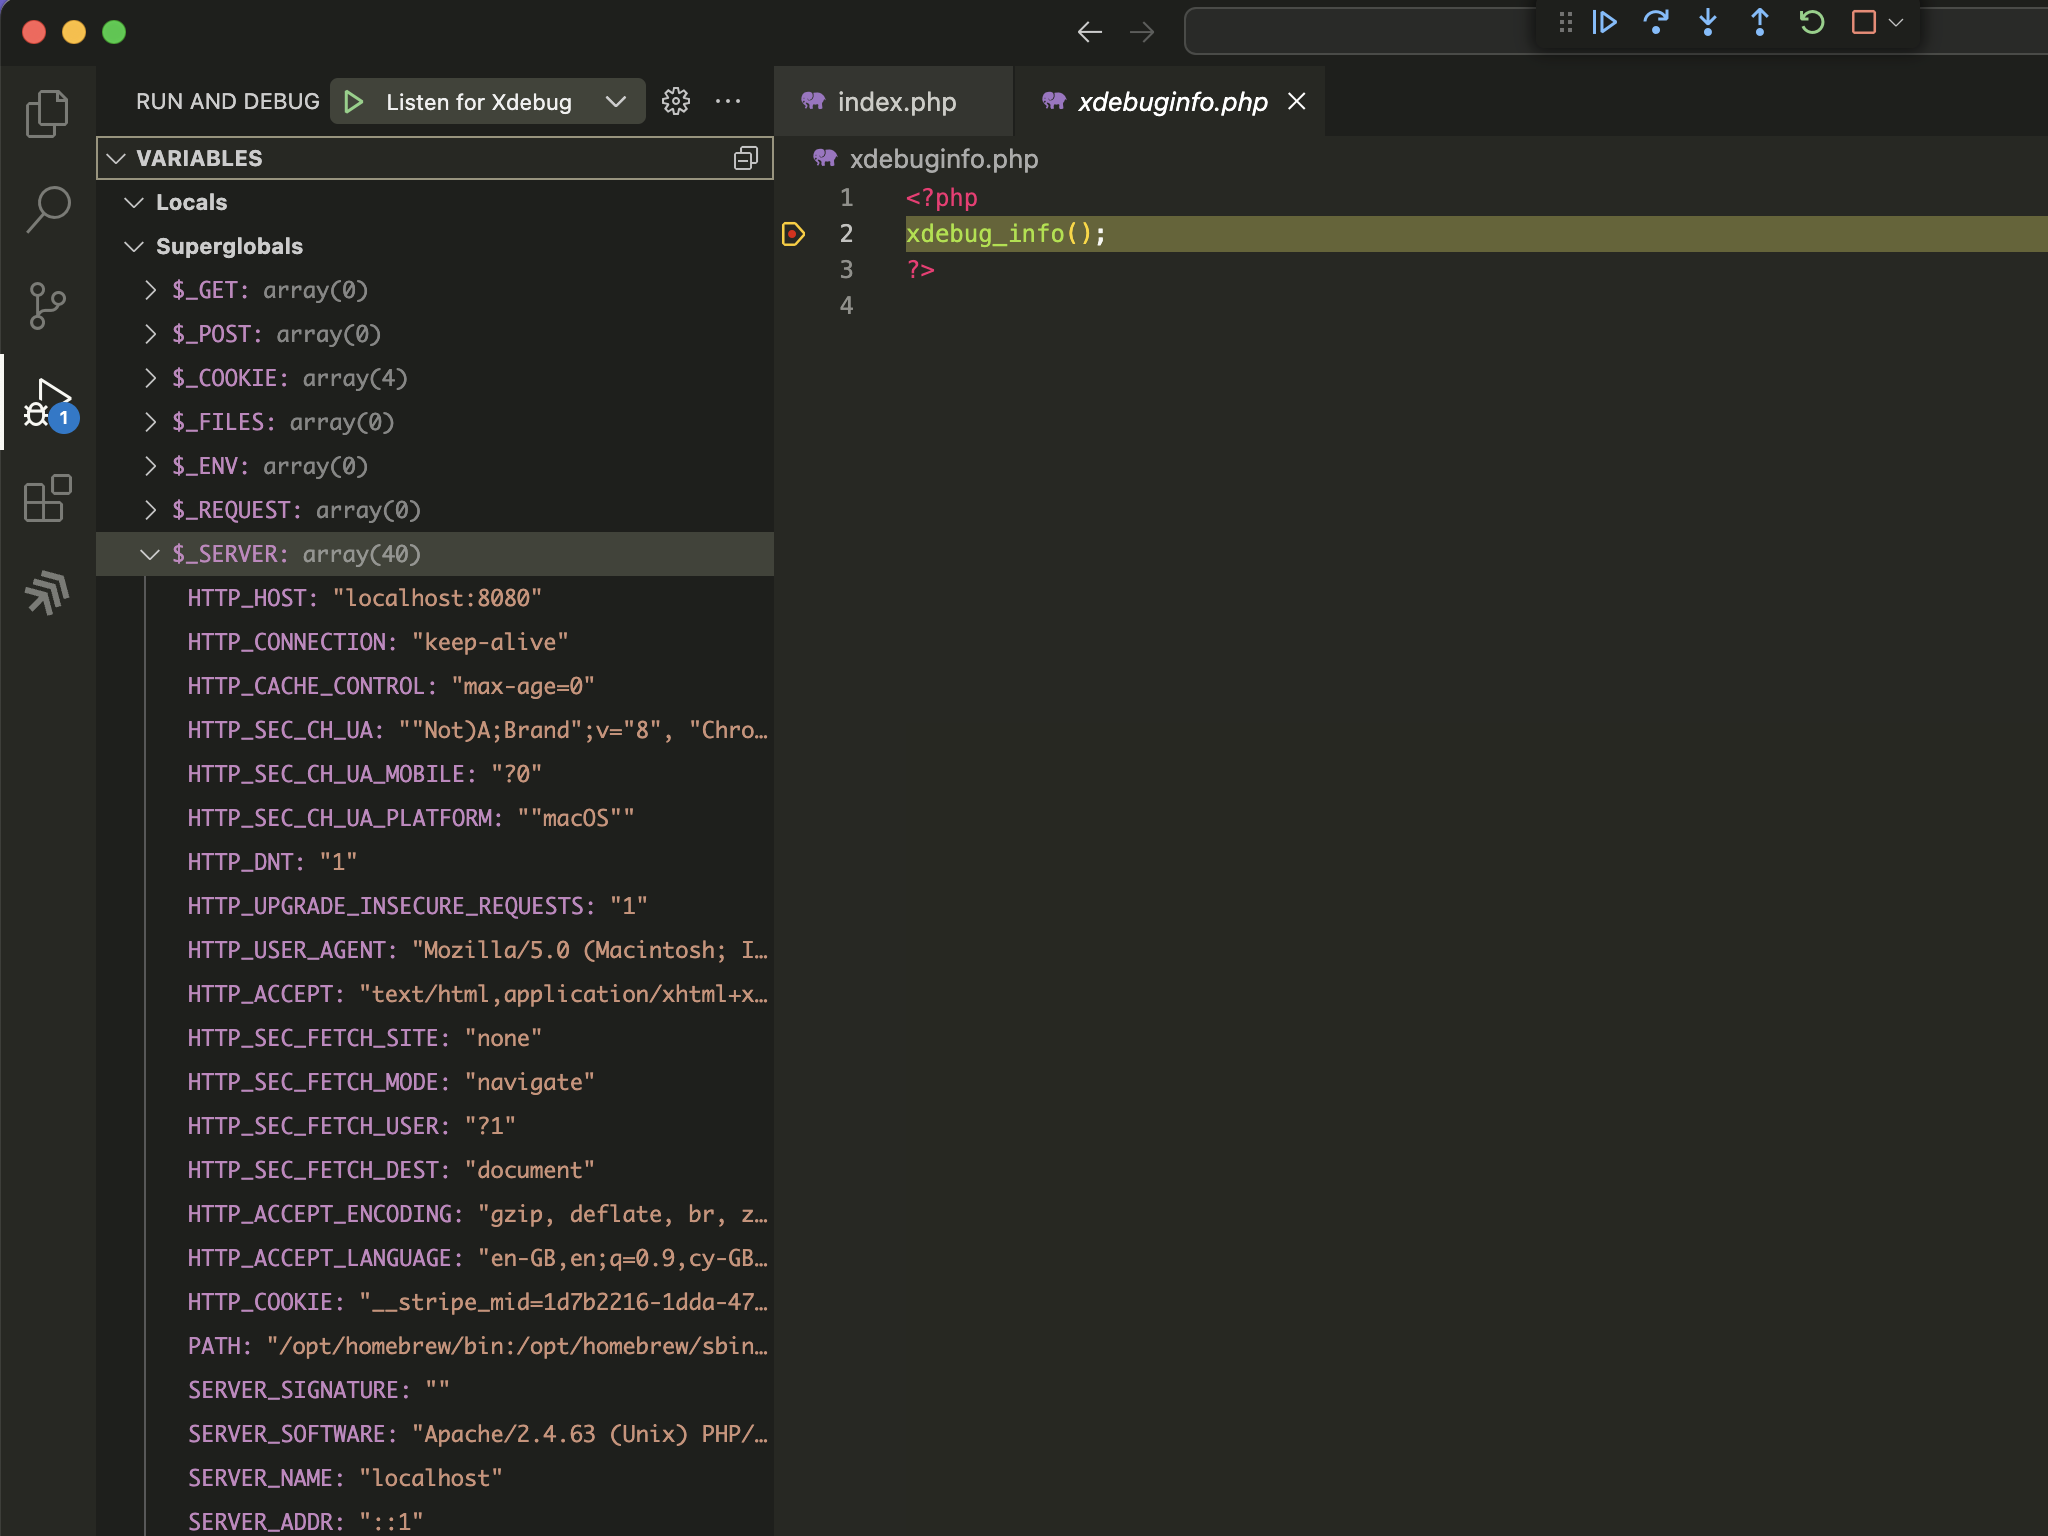
From here you can inspect the full variable state, step through code line by line, and examine the call stack. For Joomla development, this is where the real value shows: you can follow a request through the application layer, into a component controller, and down into a model method — watching exactly how data transforms at each step.

Using Xdebug with PhpStorm
If you're working in PhpStorm, the integration is slightly different but ultimately more seamless. PhpStorm has built-in Xdebug support — no extension to install. Configure your PHP interpreter under Settings → PHP, point it at your Homebrew PHP binary, and PhpStorm will detect Xdebug automatically.
Enable "Start Listening for PHP Debug Connections" from the toolbar or the Run menu, set a breakpoint, and trigger a session from your browser using Xdebug Helper. PhpStorm will prompt you to map the remote path to your local project on the first connection — for a local setup, the paths are identical, so this is straightforward.
PhpStorm's Joomla-specific tooling (framework support, database tools, and its understanding of Joomla's MVC structure) makes it worth considering for larger projects, even though the setup cost is higher than VSCodium.
Troubleshooting common issues
Even with a clean setup, a few issues come up regularly:
- Port conflicts. Xdebug 3.x defaults to port 9003. If something else is using that port, change
xdebug.client_portin your99-xdebug.iniand update your IDE configuration to match. Runlsof -i :9003to check whether the port is in use. - Multiple PHP installations. Homebrew can have several PHP versions installed. Confirm which one your web server is using — it may differ from the CLI version. Run
php --inifrom the CLI and compare the configuration path against what your web server reports viaphpinfo(). - Apple Silicon path differences. Homebrew on Apple Silicon installs to
/opt/homebrew/rather than/usr/local/. If you're following older guides that reference/usr/local/etc/php/, substitute/opt/homebrew/etc/php/accordingly. - Xdebug not triggering. If you've set
start_with_request=trigger, Xdebug won't activate without the browser cookie. Confirm Xdebug Helper is enabled for your tab (the icon should be green or show a bug symbol). Alternatively, temporarily switch tostart_with_request=yesto rule out trigger issues — but switch back afterwards, since this will slow every PHP request. - Firewall blocking connections. macOS's application firewall occasionally blocks VSCodium or PhpStorm from accepting incoming connections. If prompted, allow the connection. You can also check under System Settings → Network → Firewall.
- The xdebug.ini file isn't loading. Naming the file
99-xdebug.iniensures it loads after other extensions. Confirm it's in the correctconf.ddirectory by runningphp --iniand checking the listed scan directory.
Final thoughts
Setting up Xdebug on macOS for Joomla development takes an hour or two the first time, but it pays back that investment quickly. Being able to pause execution inside a Joomla component, inspect the full application state, and step through logic in real time is a fundamentally different experience from reading log files or scattering var_dump() calls through your code.
With Xdebug 3.4 stable, PHP 8.4 well-supported, and Joomla 5.x the current target, the stack described here is current and production-relevant. The configuration is minimal, the tooling is mature, and the debugging experience is as good as it's ever been for PHP development on macOS.
Get it set up once, commit your launch.json to your project, and you won't have to think about it again — until the next time a bug in your Joomla extension turns out to be three layers deeper than you expected.
Next steps: Once you're comfortable with step debugging, explore Xdebug's profiling mode (xdebug.mode=profile) to identify performance bottlenecks in your Joomla extensions. The Cachegrind output files it produces can be opened in tools like QCacheGrind on macOS to give you a visual breakdown of where your code spends its time.